Conceptualising the project
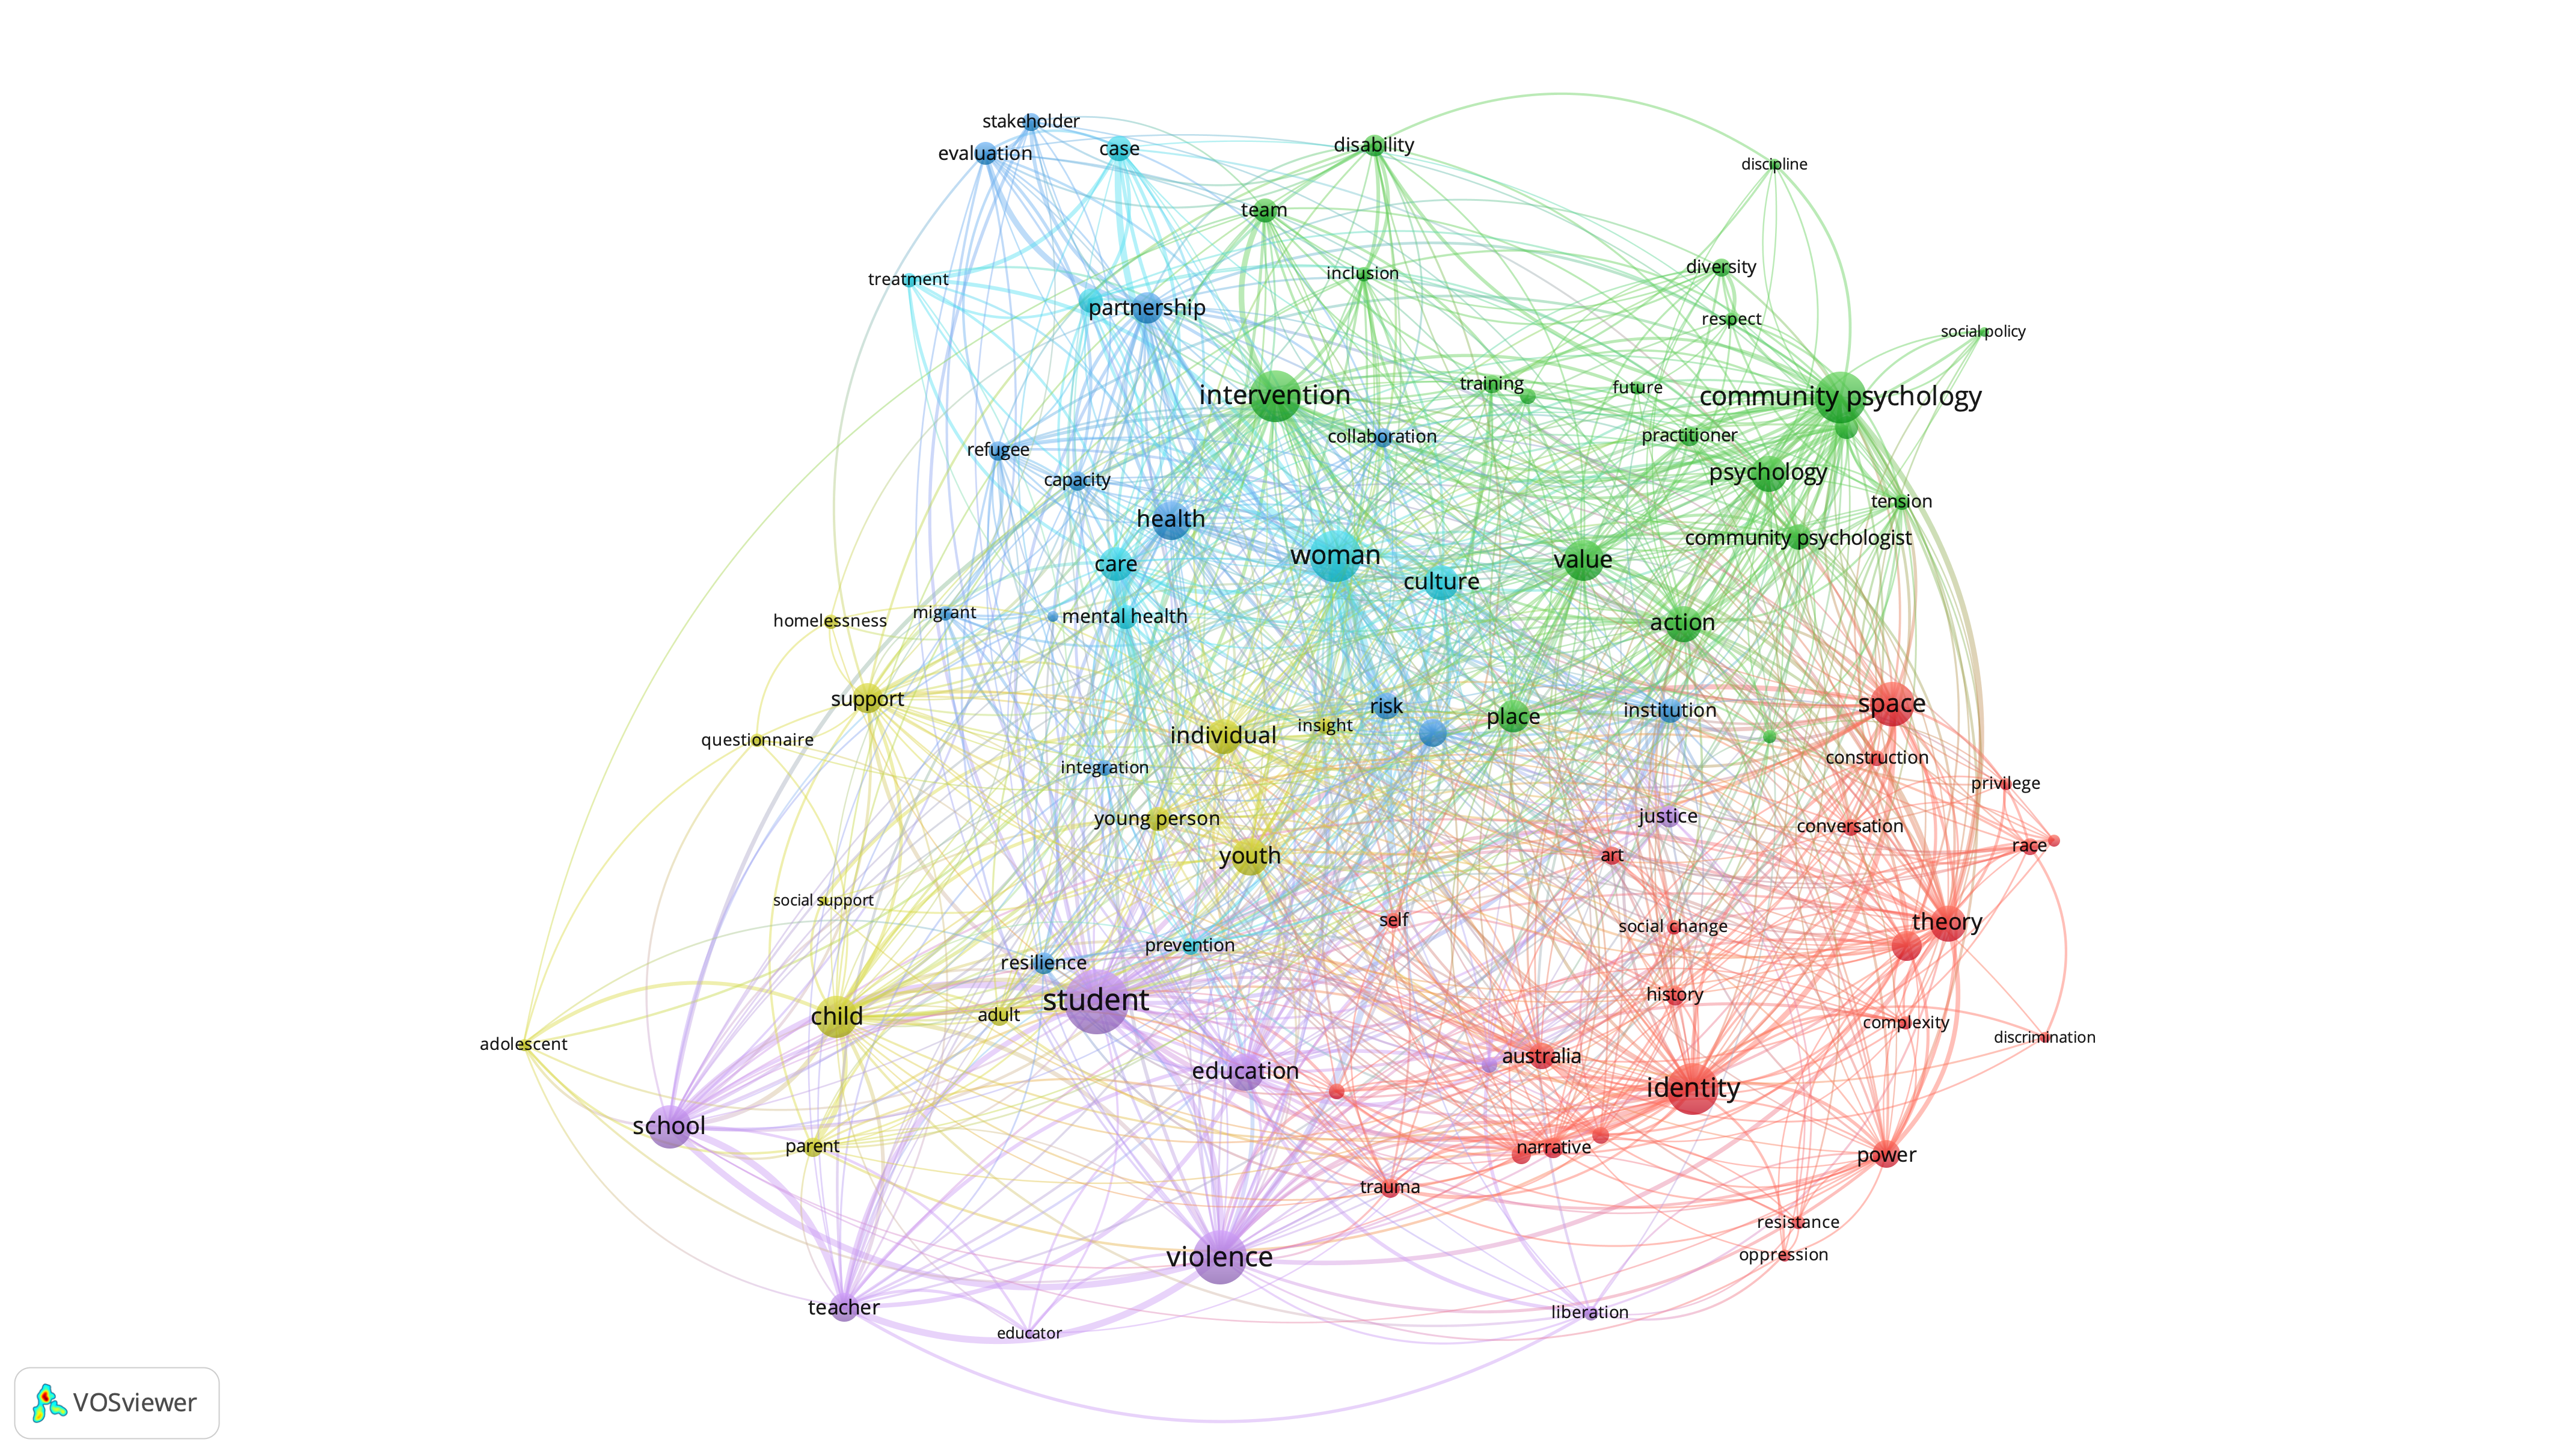
Using the publicly available information and published conference books of abstracts, this project is compiling a series of visualisations that express some of the rhizomatic nature of the ICCP conference community. Rhizomatic as concept was deployed by Deleuze and Guattari, who used it to describe theory and research that allows for multiple, non-hierarchical entry and exit points in data representation and interpretation. Others have used similar botanical metaphors such as mycelium, which refers to the root like structures of fungi made up of thread-like hyphae. There is scholarship that has detailed the values, concepts, methods, and histories that make up the constellation of international or global community psychology, but less attention has been given to the unique contribution the international conference contributes to this global community. Therefore, this project aims to capture and make visible some of the networks and relationships between people, topics, ideas and language to see the ways in which they have evolved over the life of the ICCP conferences.
Process overveiw
A more detailed method section will be published when the project is completed, so following is a brief overview of the data gathering and collation. The data sources being used for the project are the books of abstracts published by each host country. Generally, these contain the titles, abstracts, authors/presenters’ names, affiliation information and country of the submission. As there are no proforma documents for these, the information can vary across each of the conferences and details like affiliation and country generally only apply to the lead or submitting presenter.
The project has begun with information from the most recent ICCP conference in 2020 Naarm | Melbourne Australia. The data from over 300 workshops, presentations, symposia and posters were manually entered into a bibliographic software program. From there, select information was used to generate the visualisations (see details on each visualisation page). As the project is evolving and other conference data is added and collated, cross-conference analysis will also be undertaken. Therefore, ultimately the visualisations will respond to the following questions:
- What does the number of submissions per country and per organisation/institution look like for each conference and across all conferences?
- How are presenters and co-presenters connected through their work at each conference and across all the conferences?
- What are the main ideas, words, language, emerging from each conference and across all conferences?
- How do these change over time and with each host country?
To explore each visualisation, click a button below
This is a project currently being undertaken by Dr. Sam Keast from the Dynamics of Community Research Group at Victoria University, Naarm | Melbourne Australia.